When you’re trying to grow your rental store, it’s easy to fall into a love-hate relationship with metrics and KPIs. But without tracking the right ones, it’s hard to know what’s working and what you need to improve to increase your bottom-line.
With digital analytics being so easy to access, many rental businesses leave a golden opportunity on the table. However, while tools like Google Analytics collect a ton of data, it can be overwhelming to decide which numbers you should measure to understand how your rental website is doing. In other words, it’s hard to see the forest for the trees.
So, what are metrics and KPIs exactly, and which should you track to improve your rental store’s performance? In this article, you’ll learn all about four metrics that are crucial to rental companies.
You can then use these KPIs to discover actionable insights from your data and make impactful improvements to your rental website.
What are KPIs & why do they matter?
Before we look at the metrics and KPIs you should track, let’s clear up the differences between them. As a rental business owner, you want to track both metrics and key performance indicators (KPIs), but many people confuse the one for the other.
Simply put, metrics are just a way of measuring things. The number of visitors, average time on page, bounce rate, etc. And KPIs? Those are the metrics that matter. They’re often linked to specific goals and can be used to track your rental store’s success. KPIs are often linked directly to conversions, purchases, and other metrics related to revenue goals.
Here’s a more practical example: It’s great to know how much time people spend on your website, but tracking the number of bookings your receive really indicates performance.
Now, let’s jump in. Here are the four KPIs you should track on your rental company’s website.
Start your rental business for just $27/month
Put your toes in the water and test the demand in your area with a rental website for just $27/month.
1. Website traffic
First and foremost, you want to know where your website traffic is coming from. Tracking this over time can give you an idea of how many visitors you’re driving to your rental store, their physical location, and the marketing channels involved. It’s a good place to start when you want to track the performance of your marketing campaigns.
Once you start analyzing your website traffic, you’ll be able to make more informed decisions about your marketing efforts and targeting. By using the Audience and Acquisition reports in Google Analytics, for example, you’ll get an in-depth view of who’s visiting your rental website:
Demographics
The demographics report in Google Analytics tells you more about your website visitors’ age range and gender. Applying this knowledge to your content can make it resonate more with your audience.
Geo
Geographic data about your website visitors includes their physical location and the language they speak. These insights can help you decide whether you need a multi-lingual rental store to accommodate customers from different countries, for example.
Mobile
Another metric you’ll find is whether people visit your website on desktop, mobile, or tablet. It’s crucial to know which devices people use so you can optimize your rental store accordingly. However, it’s not a matter of one or the other — make your website responsive to ensure people have a good experience on any device.
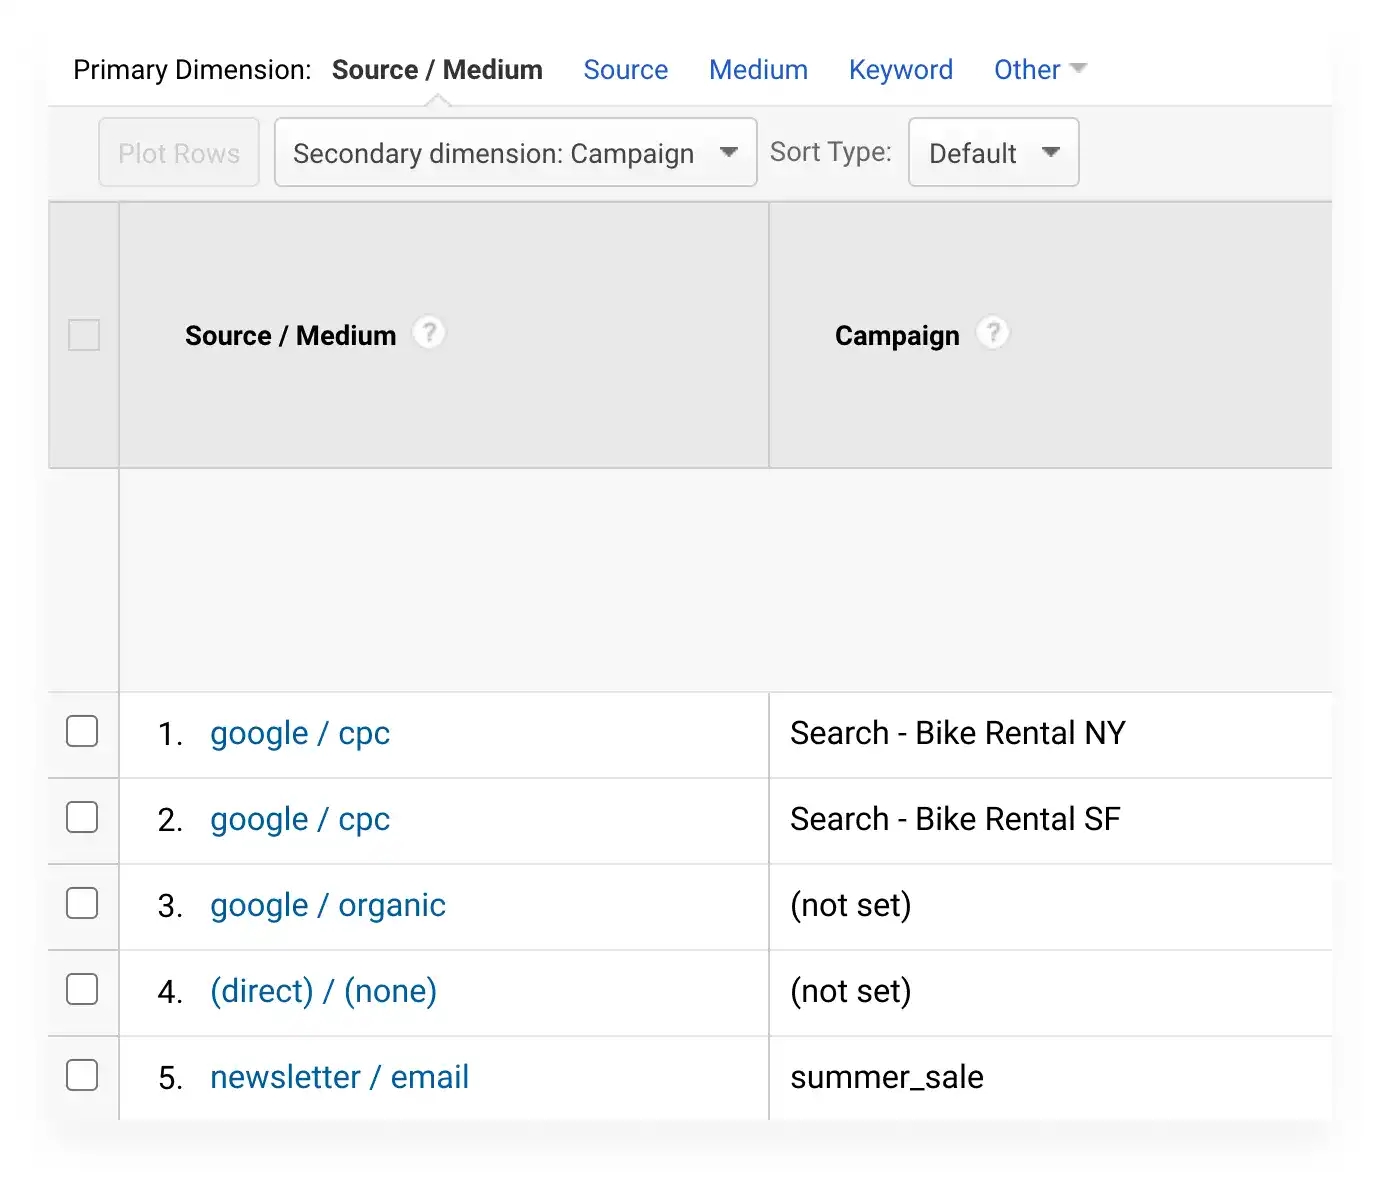
Source, medium, and campaign tracking
Pretty much all website traffic gets attributed to a channel. People can find your rental store through various channels, such as Organic Search, Paid Search, and Direct. Next, we can break these channels down into sources, mediums, and campaigns for more in-depth analysis:
- Source: The specific sites (or referrers) within these channels are called sources. For Paid Search, these can be Google or Facebook, but Newsletter can be a source too.
- Medium: The medium that features your tracked link can be very similar to the channels mentioned above. Typical mediums are cpc (for cost-per-click advertising), social, or email.
- Campaign: The campaign parameter enables you to identify a specific product name, promotion, or marketing campaign in your analysis. For example, “summer_sale.”
If you want to measure the performance of your marketing efforts in Google Analytics, we recommend adding UTM parameters to your URLs for each marketing campaign. Here’s a practical example of how to use these parameters successfully:
https://exampleurl.com/?utm_source=google&utm_medium=cpc&utm_campaign=summer_sale
And here are the same parameters in Google Analytics:
Note: Google’s Campaign URL Builder allows you to add UTM parameters to your URLs quickly.
2. Conversion rates
How effective are your product pages? Are you just providing features and specs, or do they encourage people to rent your products? Your conversion rates will reveal the answer.
Conversion rate is the percentage of your total number of visitors who take a specific action on your website. This action can be anything you want, such as making a booking, signing up for a newsletter, or filling out a contact form. Your conversion rate shows you how well your pages perform in regards to these desired outcomes.
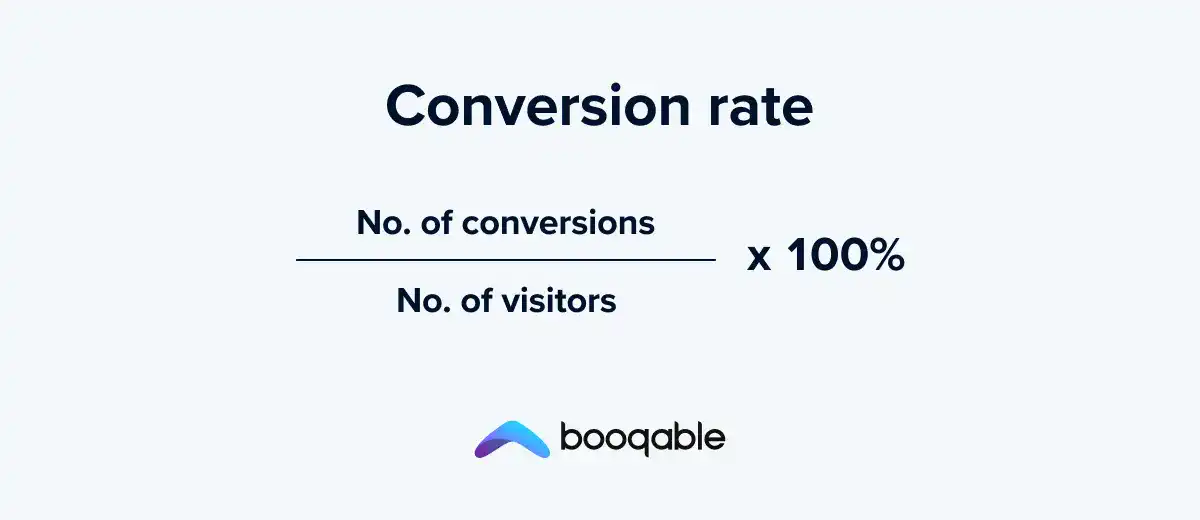
Here’s an example: if you get 60 bookings from 2,000 website visitors, your conversion rate is 3%.
Suppose one of your product pages is getting a lot of traffic but very few conversions. In that case, this could suggest that visitors are expecting something else, or your product information isn’t compelling enough.
Because many different factors can influence your conversion rate, you’ll need to test ways to improve your website to increase conversions.
Your conversion rate is one of the key metrics to optimize. Here’s why:
Say that you get 2,000 visits on your website and 3% convert and rent a $50/day product for 3 days.
In this example, you’ll make $9,000.
Now, suppose you increase your conversion rate by just 0.5%, you’ll make $10,500. That’s an additional $1,500.
Because small changes can result in big wins, it’s important to keep finding ways to increase your conversion rates.
Note: Do you think your product descriptions need some work? Here’s how to write compelling descriptions that persuade your customers.
Start with building your rental website
Every new rental business starts with a website to get their first bookings.
3. Average order value (AOV)
Another e-commerce metric is the average order value. AOV refers to the average amount of money spent by customers on a single booking.
You can calculate the average order value by taking your total revenue and dividing it by the total number of bookings for a given period:
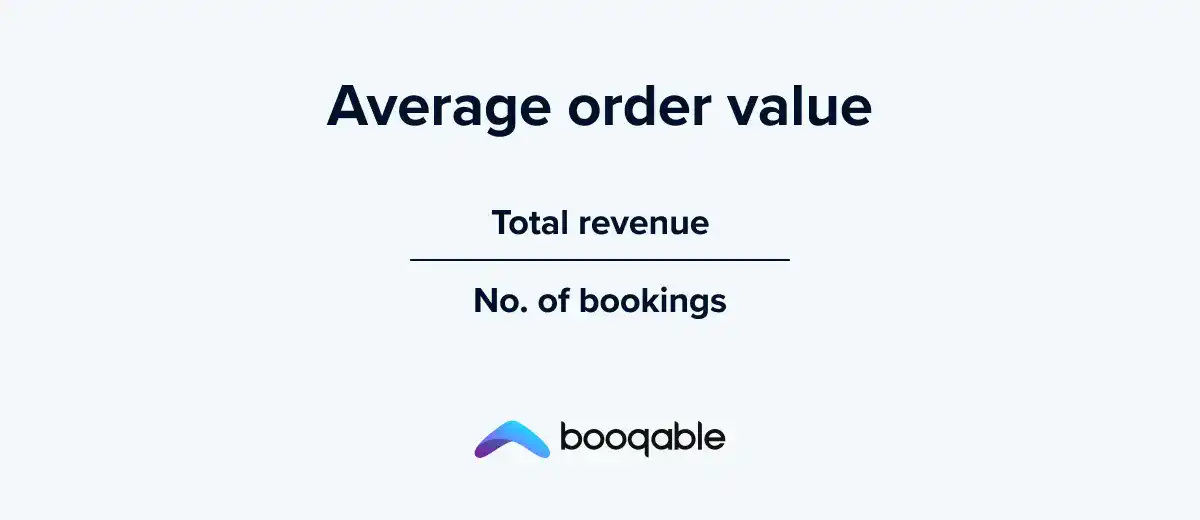
For example, if you made $7,000 from 100 bookings in one month, your AOV would be $70.
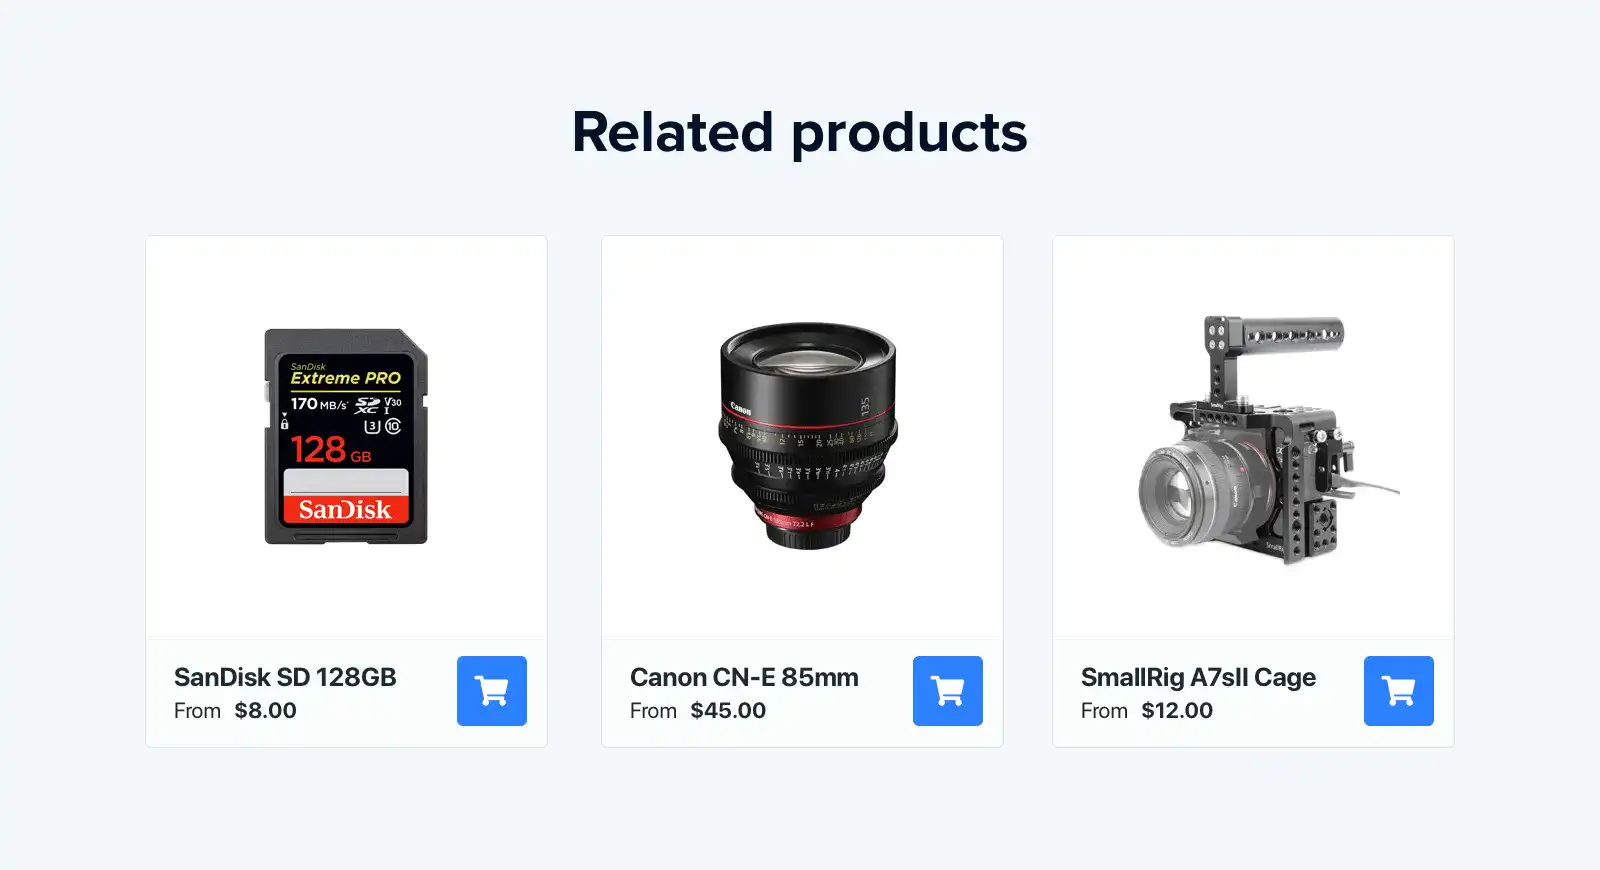
One of the most popular strategies to increase your customers’ average order value is cross-selling. Cross-selling means that you’re trying to persuade visitors to rent more by suggesting related products. However, it’s critical to keep these recommendations relevant.
For example, if you rent out camera gear, you could cross-sell products like lenses, stabilizers, or other accessories. And, if you rent out bikes, you could cross-sell helmets, pedals, or child seats.
Besides increasing your average order value, product recommendations can also improve the customer experience as some visitors may have forgotten certain items or didn’t realize they needed them.
The same goes for product bundles. You can encourage customers to rent more by offering packages at a discounted rate. Bundles don’t just increase your AOV but also save people time as they won’t have to search for individual products themselves. Plus, for rental companies it’s much easier to track a bundle than each item separately.
Note: As with any sales technique, it’s best to put the customer first and not overdo it. Always make sure the products you’re cross-selling or bundling are relevant and provide value.
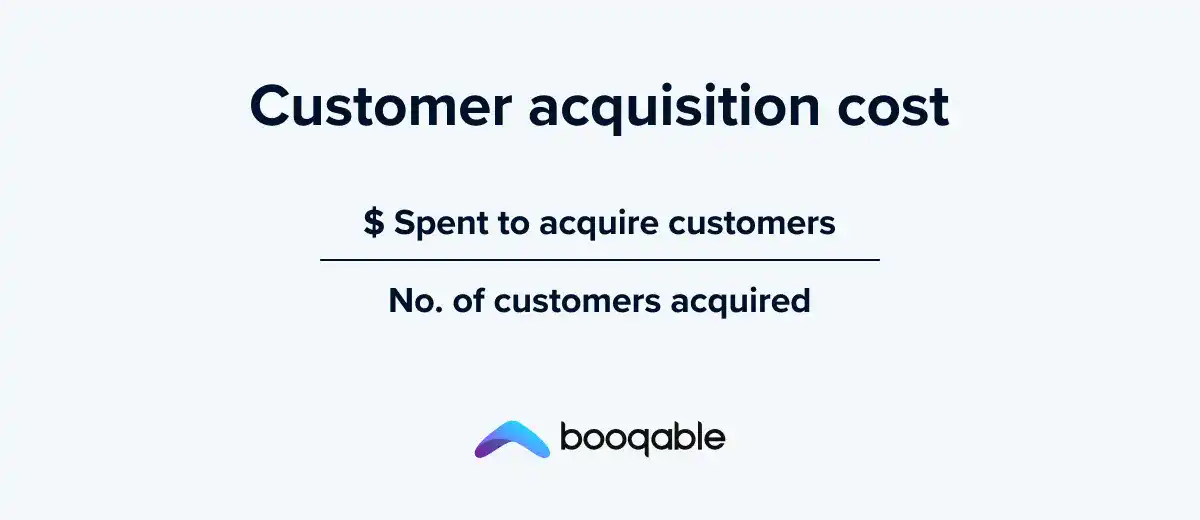
4. Customer Acquisition Cost (CAC)
How much money are you paying to acquire a new customer? CAC, or customer acquisition cost, is the metric that helps you understand just that.
It generally includes advertising costs, the salary of your marketers, etc., divided by the number of customers acquired. Here’s how to calculate the customer acquisition cost for your rental store:
Tracking your CAC will allow you to allocate your marketing budget more effectively and ensure you’re making the right decisions. Let’s see how this typically works:
If your average order value is $5,000 for high-end camera gear, spending $100 to acquire a customer is a bargain. But if you’re renting out bikes for $70, you’ll need to rethink your CAC.
Why does your CAC matter so much? Well, if your customer acquisition cost is higher than your revenue for long enough, you’ll soon go out of business.
Summary
Metrics and KPIs can feel overwhelming, and tracking them may seem challenging. But defining your goals and measuring the right KPIs will undoubtedly be worth your time and effort.
You don’t need to keep track of every number or percentage. You now have four metrics to track as a starting point. And as you grow more comfortable, you can go more in-depth and measure your rental store’s performance with more KPIs.
Ultimately, understanding how your rental store performs will lead to better decisions. Decisions around where to allocate your budget, which pages to optimize, and how much you’re willing to spend to acquire new customers. All of these decisions have an immense impact on your business’ growth.